How to create your own website: Measuring the results

You have a website which you’re actively advertising. How do you know if all the work you've put in has been worth it? How do you know what works and what doesn’t? You need website visitor statistics and analysis.
What do you gain from analyzing visitor statistics?
In brief, website visitor statistics will let you determine:
- How many people visit your website and on what days. This will let you get a general understanding and follow progress.
- Where your visitors are coming from. This will let you understand which marketing methods are working and which aren’t.
- Which sections of your website visitors are reading and how long they’re spending there. This will let you understand user needs and improve the quality of the content.
- Which countries your visitors are from etc.
How to get started with statistics analysis
There are many different tools which can help you understand what’s happening on your website. I will look at linking up Google Analytics - the most popular free tool.
In brief, it works like this:
- Create a Google Analytics account.
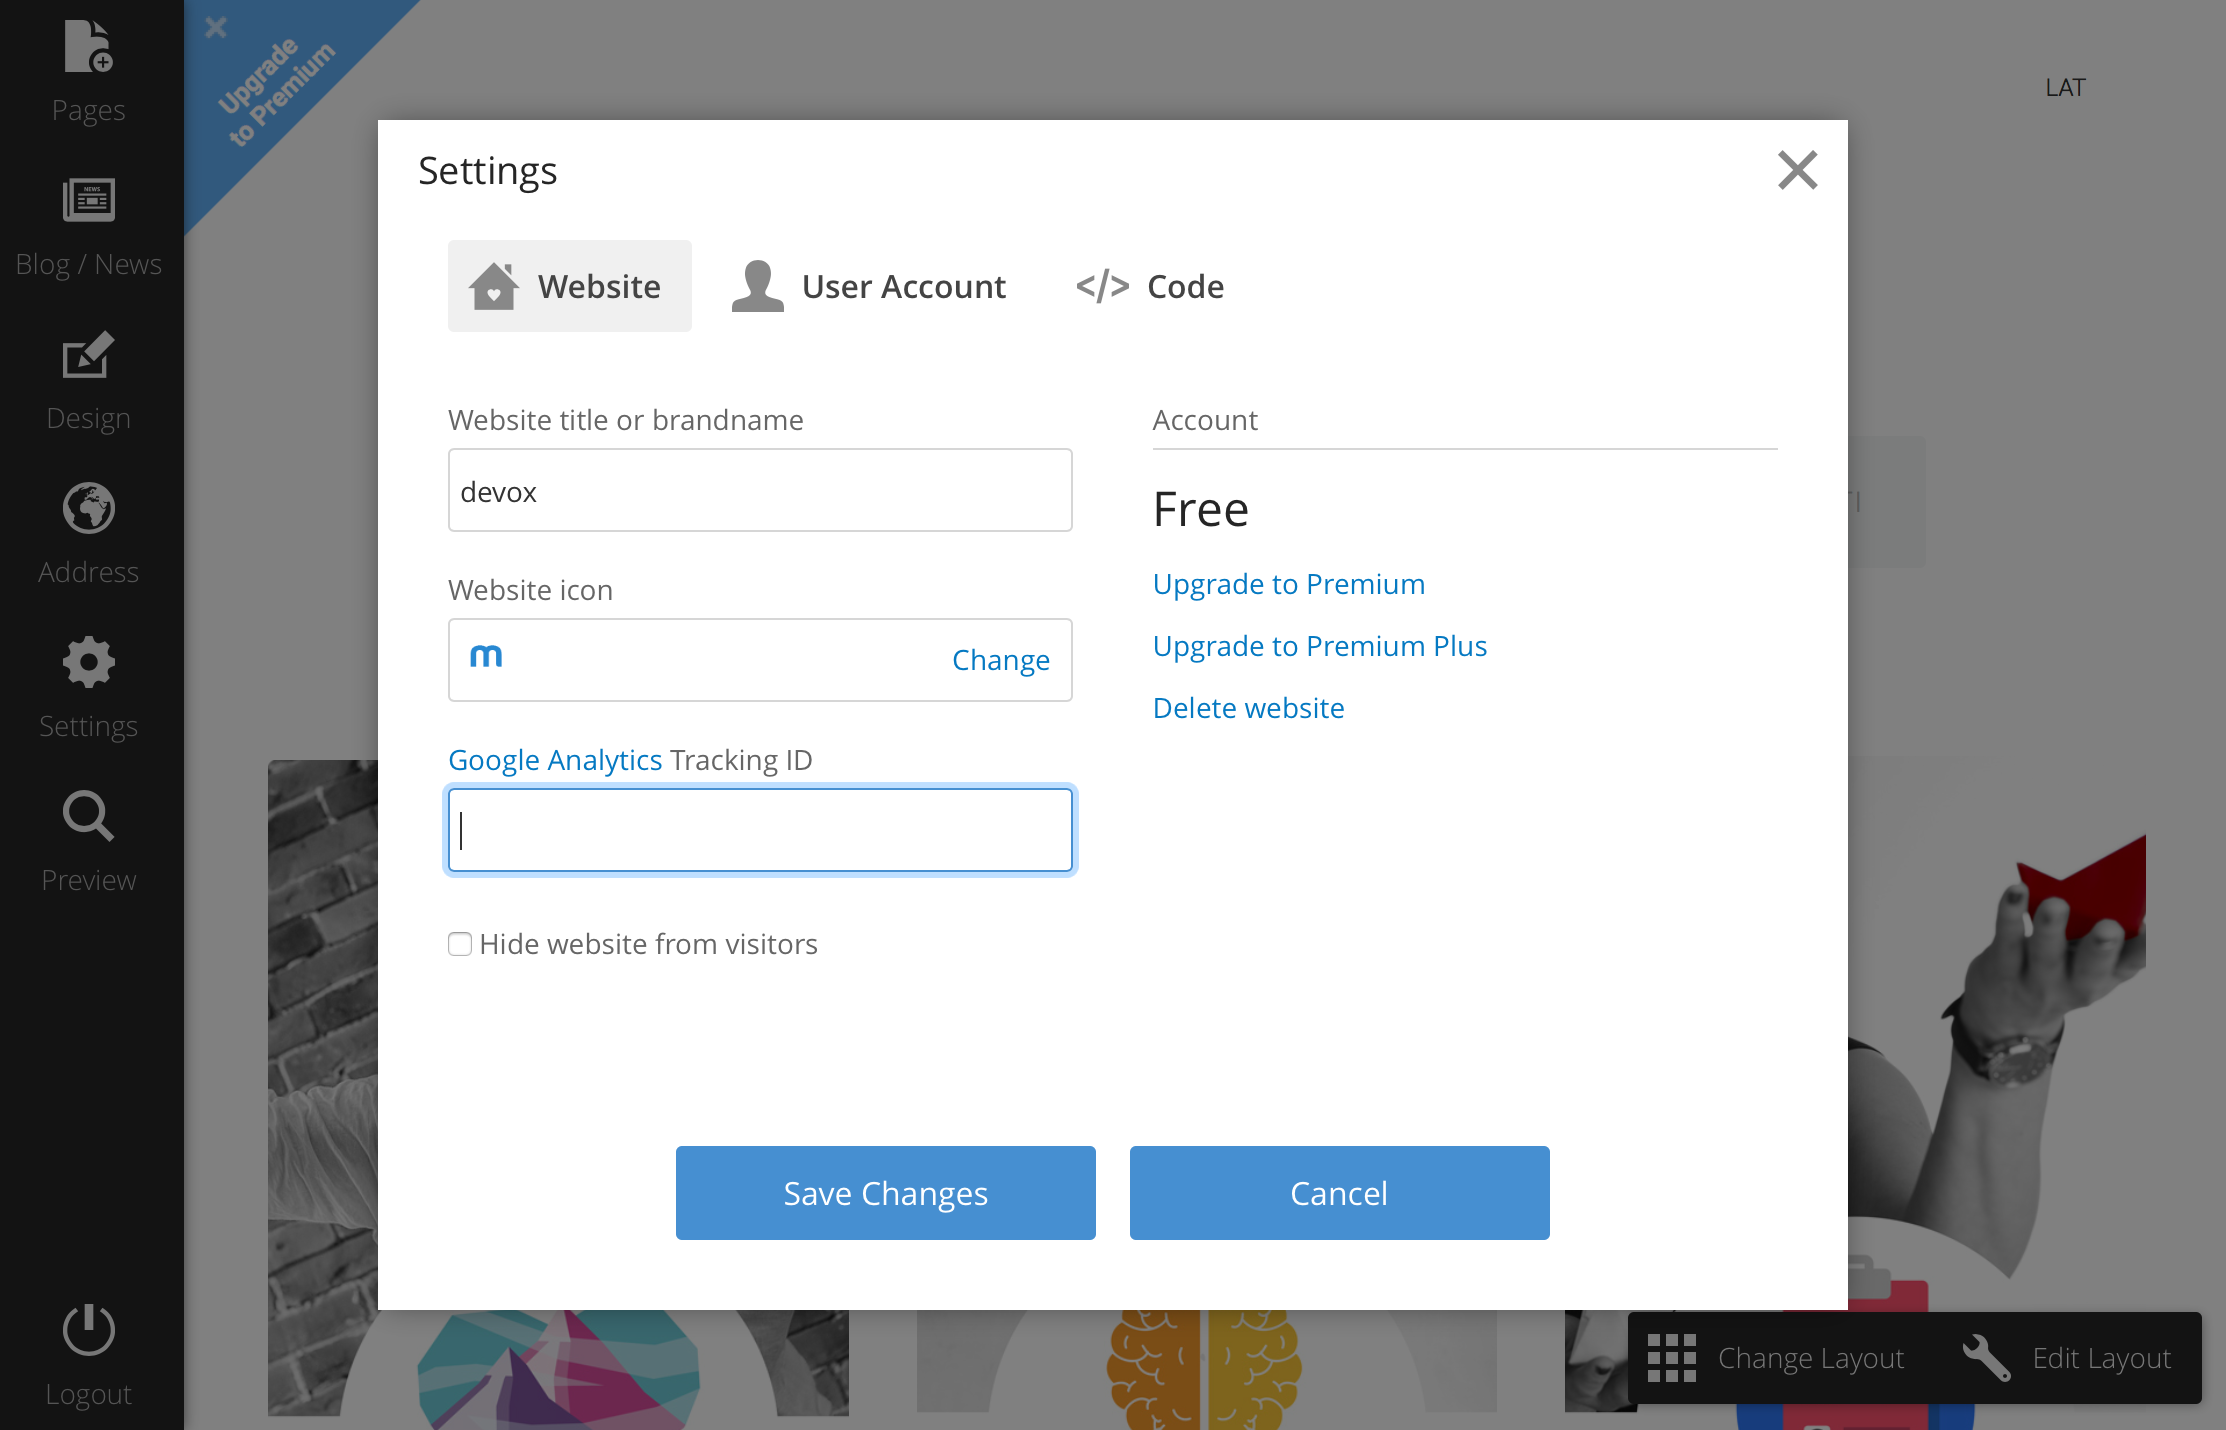
- In the settings, find the field linked to Google Analytics and enter your Google Analytics user ID (if your website’s system supports this function). Some systems will require the website admin to enter a special code.
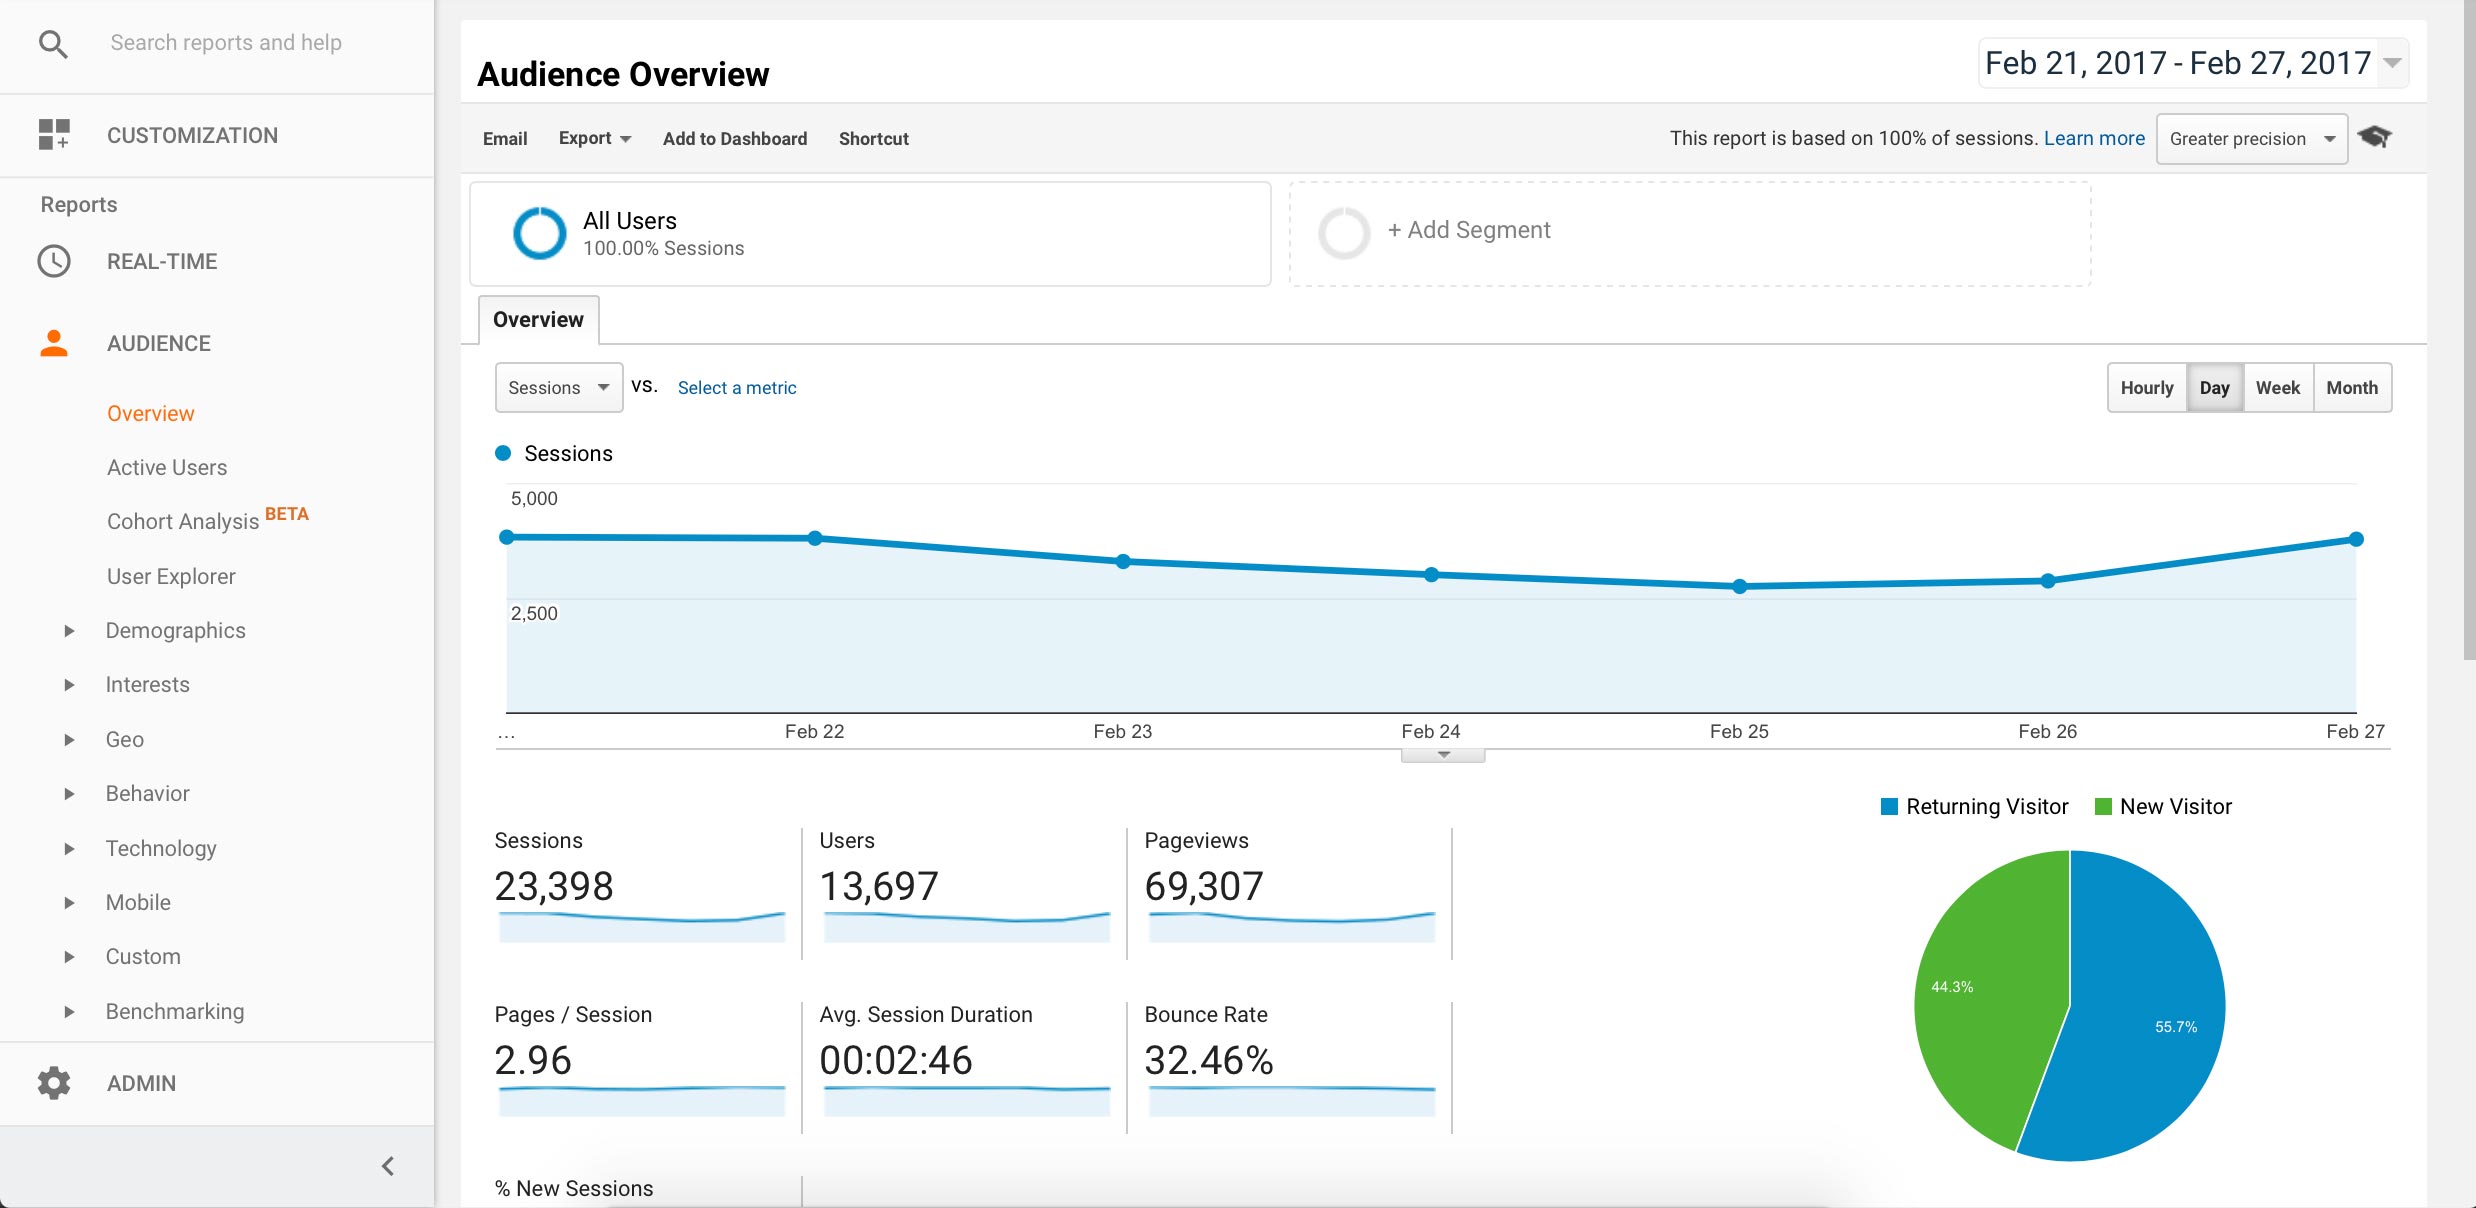
- In a few days’ time, your Google Analytics account will start showing beautiful graphs illustrating information about the number of website visitors, their characteristics and behavior.
Here's how it looks on Mozello:

The way it works
The Google Analytics code linked to your website registers every time a visitor enters your website and does something. All the data is compiled and illustrated in your Google Analytics account.
What data is available
Google Analytics will let you determine:
- How many users visit your website
- Where your users are coming from
- The times and days when users visit your website
- The average amount of time each visitor spends on the website
- What countries the users are from
- Which sections are most read and how long they’re read for
- The most commonly abandoned pages
- Hundreds of other parameters

Other approaches
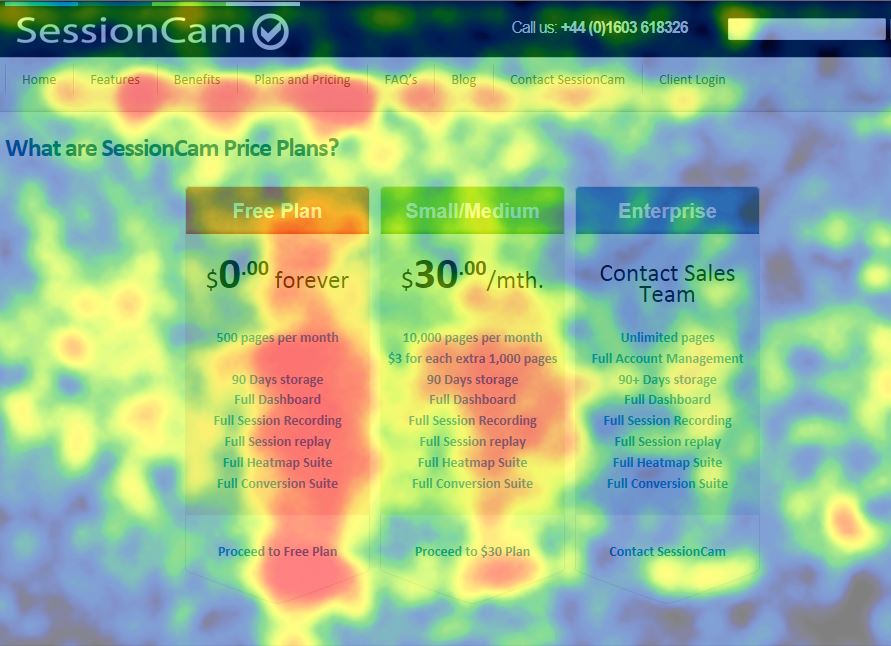
Alongside Google Analytics, there are many other interesting tools which let you research user behavior on a website and determine which parts of the website and its content visitors use the most. These tools include Inspectlet and CrazyEgg but there are many, many more. One of the functions these tools can perform is t.s.heatmaps - a visualization of user activity.

This kind of heatmap lets you understand what users are focusing on the most and what they aren’t reading at all.
Unfortunately, these high end tools tend to come at an extra cost. On the other hand, subscribing to the tool for a couple of months is usually long enough to gain a general understanding.
Summary
To understand how efficient your website is, you need to monitor what’s going on on the website and make any necessary adjustments to your advertising and website content. The cheapest and most straightforward solution is to start with the free-of-charge Google Analytics.
